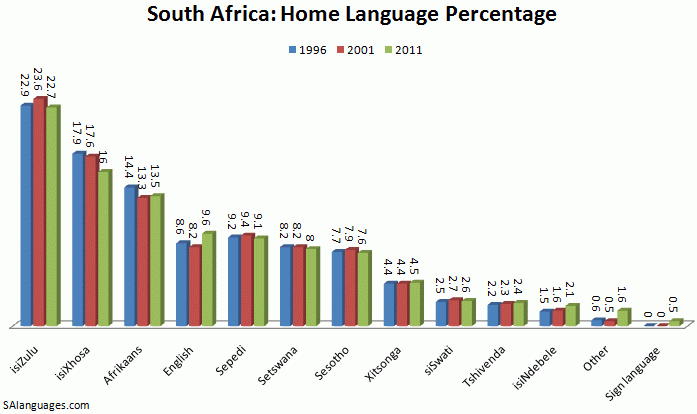
Percentage of speakers per home language in South Africa (1996, 2001 and 2011)

Number of speakers per language in South Africa (1980, 1991, 1996, 1998, 2001
and 2011)
| LANGUAGE |
1980 |
1991 (a) |
1996 |
1998 (b) |
2001 (c) |
2011 (d) |
| isiZulu | 6 064 480 |
8 343 587 |
9 200 144 | 10 194 787 | 10 677 305 | 11 587 374 |
| isiXhosa | 2 879 360 |
6 729 281 |
7 196 118 | 7 610 435 | 7 907 153 | 8 154 258 |
| Afrikaans | 4 925 760 |
5 685 403 |
5 811 547 | 5 945 805 | 5 983 426 | 6 855 082 |
| English | 2 815 640 | 3 422 503 | 3 457 467 | 3 692 157 | 3 673 203 | 4 892 623 |
| Sepedi | 2 431 760 |
n/a |
3 695 846 | 3 832 645 | 4 208 980 | 4 618 576 |
| Setswana | 1 444 908 | 3 368 544 | 3 301 774 | 3 613 925 | 3 677 016 | 4 067 248 |
| Sesotho | 1 877 840 | n/a | 3 104 197 | 3 539 261 | 3 555 186 | 3 849 563 |
| Xitsonga | 888 140 | 1 439 809 | 1 756 105 | 1 776 505 | 1 992 207 | 2 277 148 |
| siSwati | 650 600 | 952 478 | 1 013 193 | 1 068 733 | 1 194 430 | 1 297 046 |
| Tshivenda | 169 740 | 673 538 | 876 409 | 1 227 824 | 1 021 757 | 1 209 388 |
| isiNdebele | 459 880 | n/a | 586 961 | 654 304 | 711 821 | 1 090 223 |
| Other | 292 360 | 640 277 | 228 275 | 157 767 | 217 293 | 828 258 |
| Sign language | n/a | n/a | n/a | n/a | n/a | 234 655 |
| Unspecified | n/a | n/a | 355 538 | 10 868 | n/a | n/a |
| TOTAL: | 26 271 060 | 31 255 420 | 40 583 574 | 43 325 017 | 44 819 778 | 50 961 443 |
Source: Statistics South Africa
(a) The accuracy of some data for 1991 is questioned - refer to:
Mesthrie,
R. (ed.) 1995. Language and social history: studies in South African
sociolinguistics. Cape Town : David Philip. (page xvii)
(b) October Househould Surveys: this data is not so comprehensive since it was taken from a sample set of households, and
was then extrapolated to provide a nationwide picture.
(c) Census 2001, Statistics South Africa
(2003)
(d) Latest Census 2011, Statistics South Africa (2012)
© J. Olivier (2012)
SAlanguages.com