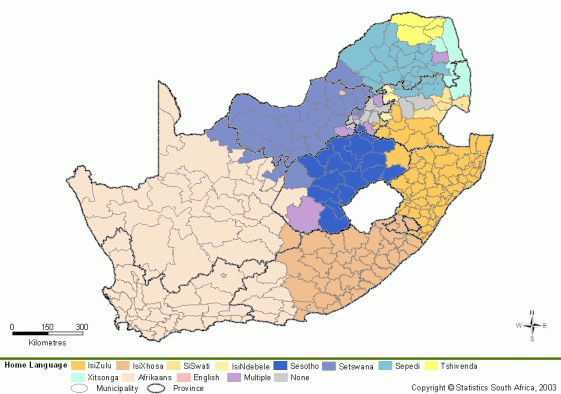
The language distribution map below shows the dominant languages per municipality in South Africa as gathered with the national census in 2001. See this page for maps of the country before and after 1994.
The StatsSA website provides digiAtlas with which detailed language data can be shown by provincial and and municipal level. For more information see: http://www.statssa.gov.za/census2001/digiAtlas/index.html
Find language specific maps below as compiled from the 1991 census data and published by the HSRC (these maps were also used in the Unesco World Languages Report of 2002). Take note that these maps do not indicate the number of speakers but the percentage of speakers per magisterial district. Furthermore the Khoesan map only indicates the approximate regions where the languages are spoken.
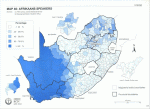 Afrikaans |
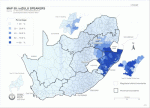 IsiZulu |
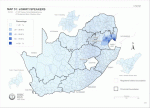 SiSwati |
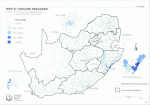 English |
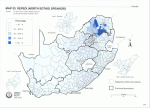 Northern Sotho |
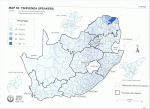 Tshivenda |
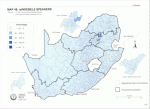 IsiNdebele |
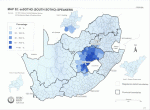 Sesotho |
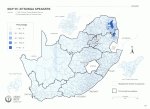 Xitsonga |
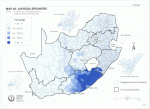 IsiXhosa |
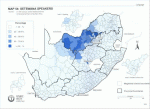 Setswana |
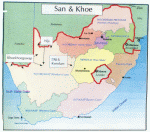 Khoesan |
© J. Olivier (2009)
SAlanguages.com